

Business Intelligence Exercises
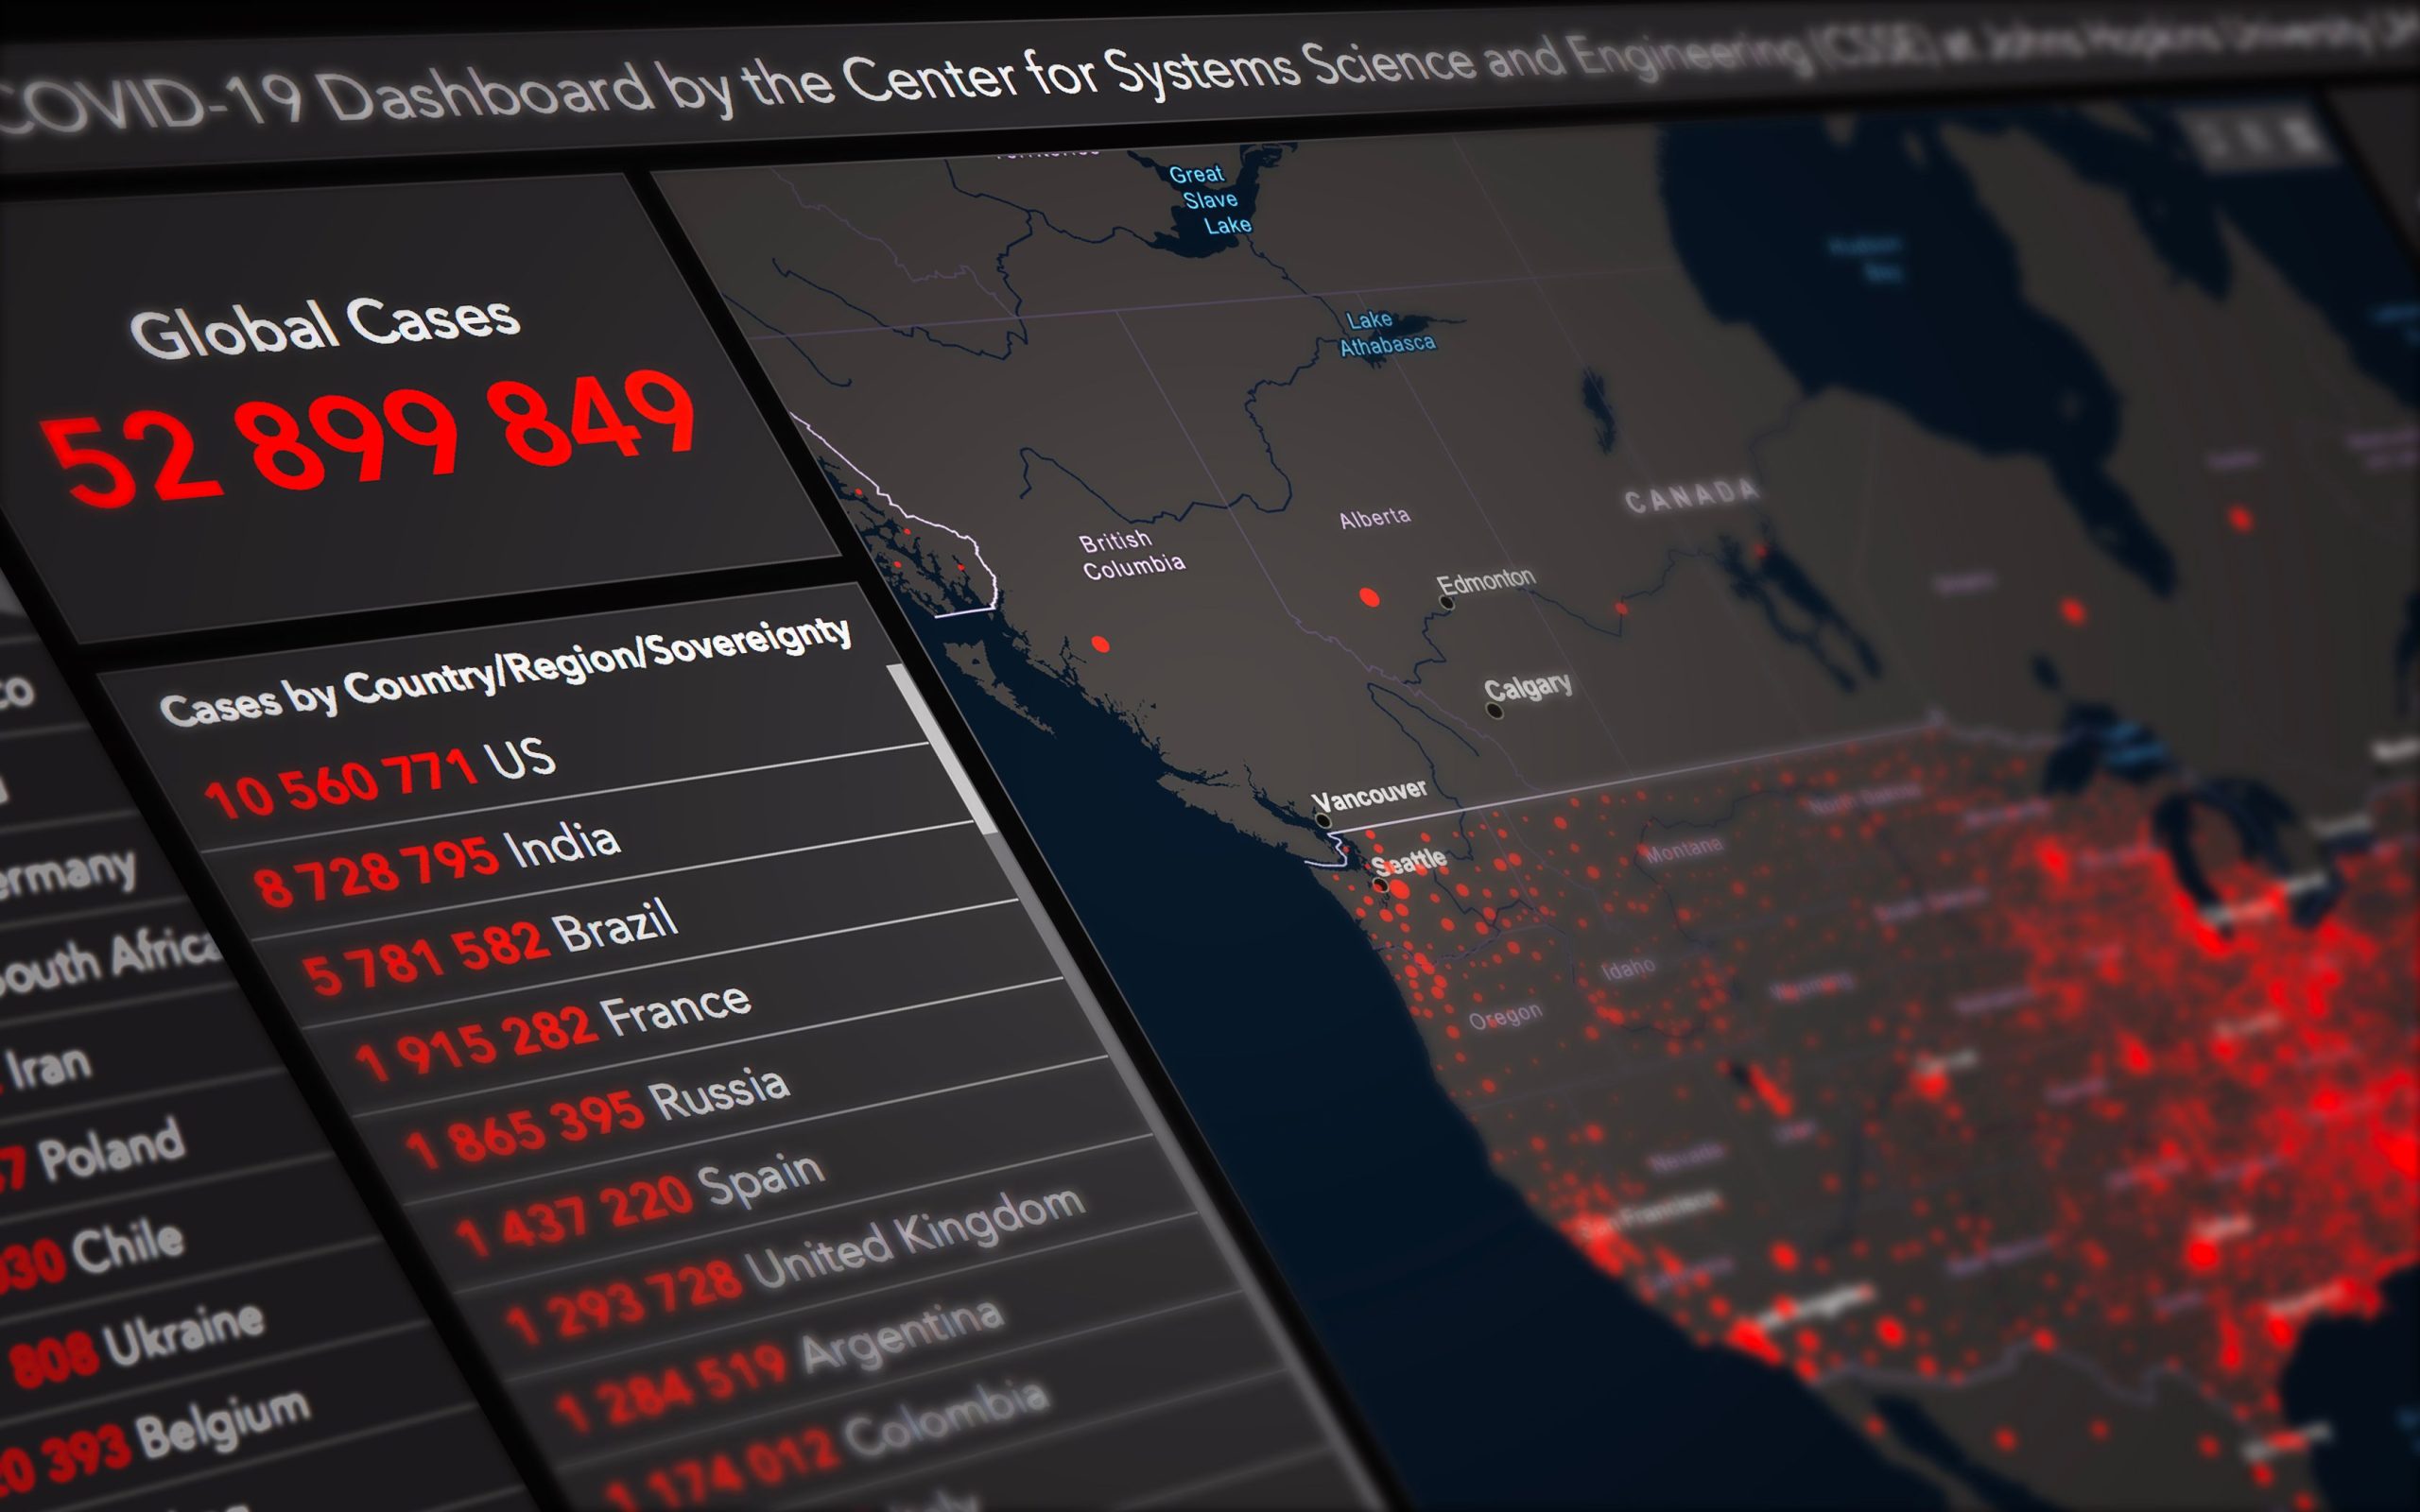
Business Intelligence (BI) is one of the most valuable skills in today’s data-driven world. Organizations use Business Intelligence to collect, analyze, and visualize data so they can make smarter business decisions. Whether you are a beginner or an experienced analyst, practicing Business Intelligence exercises is one of the best ways to improve your analytical thinking and technical skills.
This guide contains practical Business Intelligence exercises that help you understand data analysis, reporting, dashboards, KPIs, SQL, and visualization techniques.
What Is Business Intelligence?
Business Intelligence is the process of collecting, organizing, analyzing, and presenting business data to support better decision-making. BI combines data from different sources and transforms it into meaningful reports and dashboards.
Common Business Intelligence tools include:
- Microsoft Power BI
- Tableau
- Microsoft Excel
- SQL
- Google Looker Studio
- Qlik Sense
Companies use these tools to monitor sales, track customer behavior, measure employee performance, and identify business opportunities.

Why Practice Business Intelligence Exercises?
Practicing BI exercises helps you:
- Improve problem-solving skills.
- Learn data visualization techniques.
- Understand business metrics.
- Build professional dashboards.
- Gain confidence with SQL and Excel.
- Prepare for job interviews.
- Create projects for your portfolio.
Regular practice also makes it easier to work with real business datasets.
Exercise 1: Sales Performance Analysis
Imagine a company sells products in different cities.
Your task:
- Calculate total sales.
- Find the best-selling product.
- Identify the city with the highest revenue.
- Compare monthly sales.
- Calculate average order value.
Questions:
- Which month generated the highest sales?
- Which product category performs best?
- Which city has the lowest revenue?
- What is the overall profit margin?
Exercise 2: Customer Analysis
A retail business wants to understand customer behavior.
Analyze:
- Number of customers
- Repeat customers
- Average purchase amount
- Customer lifetime value
- Age distribution
Questions:
- Which customer segment spends the most?
- What percentage of customers return?
- Which age group buys the most products?
Exercise 3: Dashboard Design
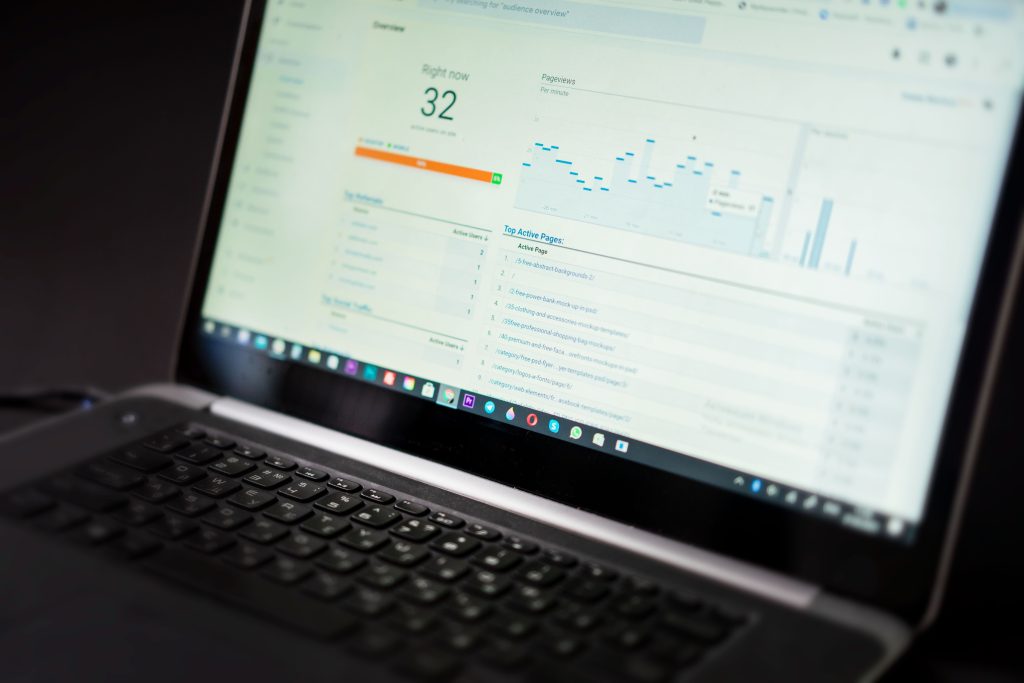
Create a dashboard containing:
- Total Sales KPI
- Total Customers
- Monthly Revenue Chart
- Product Category Pie Chart
- Regional Sales Map
- Top 10 Products Table
A good dashboard should be simple, interactive, and easy to understand.
Exercise 4: SQL Practice
Suppose you have a table called Sales.
Practice writing SQL queries to:
- Display all sales records.
- Find total sales by product.
- Show top five customers.
- Calculate average sales.
- Filter sales above a certain amount.
- Sort products by revenue.
These exercises improve your database skills and help you work with large datasets.

Exercise 5: KPI Analysis
Important KPIs include:
- Revenue
- Profit
- Gross Margin
- Customer Growth
- Sales Growth
- Return Rate
- Customer Retention
- Average Order Value
Exercise:
Explain why each KPI is important and how it influences business decisions.
Exercise 6: Data Cleaning
Raw data often contains errors.
Practice:
- Remove duplicate records.
- Handle missing values.
- Standardize date formats.
- Correct spelling mistakes.
- Remove blank rows.
- Validate numerical values.
Clean data produces more accurate reports.
Exercise 7: Data Visualization
Create charts such as:
- Bar Chart
- Line Chart
- Pie Chart
- Area Chart
- Scatter Plot
- Heat Map
Question:
Which chart is best for comparing monthly sales trends?
Exercise 8: Inventory Analysis
Analyze inventory data to answer:
- Which product is running out of stock?
- Which products sell slowly?
- What is the average inventory level?
- Which supplier delivers the fastest?
Exercise 9: Financial Reporting
Prepare a report showing:
- Revenue
- Expenses
- Profit
- Net Income
- Budget vs Actual
- Monthly Trends
Questions:
- Is the company profitable?
- Which department spends the most?
- Where can costs be reduced?
Exercise 10: Business Decision Challenge
Imagine you are the BI analyst for an online store.
Sales have dropped by 20%.
Your job is to identify possible reasons by analyzing:
- Customer traffic
- Marketing campaigns
- Product pricing
- Website performance
- Inventory levels
- Customer reviews
Finally, provide recommendations to improve sales.
Tips to Improve Business Intelligence Skills
- Practice SQL every day.
- Learn Microsoft Power BI.
- Master Microsoft Excel.
- Study data visualization principles.
- Build personal dashboard projects.
- Analyze publicly available datasets.
- Learn business KPIs.
- Improve storytelling with data.
Frequently Asked Questions
What are Business Intelligence exercises?
Business Intelligence exercises are practical tasks that help learners analyze business data, create dashboards, write SQL queries, and generate reports for decision-making.
Which tool is best for Business Intelligence?
Popular BI tools include Microsoft Power BI, Tableau, Excel, Google Looker Studio, and Qlik Sense. Beginners often start with Excel and Power BI.
Is SQL necessary for Business Intelligence?
Yes. SQL is one of the most important skills because it allows analysts to retrieve and manipulate data stored in databases.
Can beginners learn Business Intelligence?
Absolutely. Anyone can start with Excel, basic SQL, and simple dashboard exercises before moving to advanced BI tools.
Conclusion
Business Intelligence is an essential skill for anyone interested in data analytics, reporting, or business decision-making. Practicing real-world Business Intelligence exercises helps you understand how businesses use data to improve performance, reduce costs, and increase profits.
By completing exercises on sales analysis, customer insights, dashboards, SQL, KPIs, and data visualization, you will build practical experience that prepares you for real projects and job opportunities. Keep practicing regularly, explore new datasets, and continue learning modern BI tools to become a confident Business Intelligence professional.
Leave a Reply